Crime Dashboard Helpful Tips
Jump to FAQs
Helpful tips
- Narrow your search by using the filters at the top of the page (i.e., year, category, county, city, and offense).
- Consider filtering as much as possible to avoid overly “busy” charts
- Charts are automatically adjusted based on filter(s) selected.
- If no filters are selected, state-wide data will be displayed.
- If you filter by category (person, property, or society), empty charts will display for the un-selected categories.
- Example: if “Property” filter is selected, charts for Person and Society crimes will appear, but with a message stating “No data in filtered range”. You can change or de-select categories to see information in the other categories.
- To compare cities in different counties, first select the counties, then select cities.
- To select multiple counties and/or agencies, hold down the CTRL key, then left-click on additional selections.
- A blue icon at the bottom of the chart indicates the data being viewed on that chart is being filtered
- Expand column(s)/row(s) by clicking the ‘+’ wherever you see it.
FAQs
Why don’t I see my county or police department in the data?
Some counties or law enforcement agencies haven’t submitted data. Most counties are showing, but they will be blank if they haven’t submitted any data. As of March 2022, we have received data from 25 counties and 127 law enforcement agencies.
What reports are you pulling this data from?
Data comes from local law enforcement agencies in Utah participating in the National Incident Based Reporting System, or NIBRS. Law enforcement agencies will not be included in the charts if they haven’t reported data.
I’ve never heard of NIBRS before.
The federal government created the Uniform Crime Reporting (UCR) Program, which:
- Is a national program.
- Includes generic and uniform crime definitions.
- Compares data across political boundaries.
- Generates reliable statistics for use in law enforcement.
- Provides information for students of criminal justice, researchers, the media, and the public.
- Has been providing crime statistics since 1930.
- Includes data from more than 18,000 city, university and college, county, state, tribal, and federal law enforcement agencies.
- Allows you to see national data at the FBI’s Crime Data Explorer website.
NIBRS, the National Incident-Based Reporting System, is the type of reporting and it:
- Improves the overall quality of crime data collected by law enforcement.
- Uses computerized data systems to collect details about the offenses, victims, offenders, property, and arrests involved in each crime incident.
- Gathers more detailed data than the traditional summary reporting program
- Makes possible the analysis of various aspects of the crime which is occurring in our society.
- Provides law enforcement administrators, elected officials, and other planners and policymakers with the precise information they need.
Why don’t I see specific domestic violence data?
There is not a specific “Domestic Violence” offense in the Uniform Crime Reporting program. However, data is available based on the relationship information found in NIBRS between victims and offenders
Do you have more data than this? What if I want to look at data older than five years?
The dashboard reflects the most recent five years worth of data to give you an idea of crime trends. To view previous years, visit our historical Crime in Utah page, where reports are available in PDF format.
Is this data available in real time?
There is always at least a one-month validation period, sometimes two.
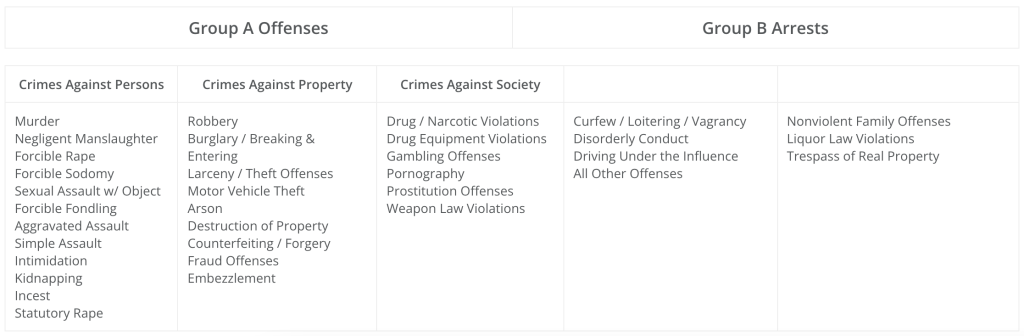
What is the difference between Group A offenses and Group B offenses?
Group A offenses are all the crime offenses that are reportable in NIBRS. Group B arrests are arrests for offenses that may only be reported when an arrest is made. For example, DUI is not a Group A offense, but a Group B arrest and we only get those counts when an arrest has been made.
Can you give me some examples?
Sure:
What are the limitations in the data presented in the dashboard?
The data shown in the dashboard is only as good as the data the state receives from our local law enforcement partners. When an agency(s) does not report or does not report in a timely manner, it may limit the data sets available.